The reason why I choose
Google Chartsas my line chart solution is because of its clean data format and a variety of options.
I have to admit that Google Charts is not the best looking one, but it is very friendly for developers. First, the data set format always looks like a table, actually arrays in an array. Having compared with other libraries, this format is the clearest one for me.
1
2
3
4
5
6
7
var data = google.visualization.arrayToDataTable([
    ["Year", "Sales", "Expenses"],
    ["2004", 1000, 400],
    ["2005", 1170, 460],
    ["2006", 660, 1120],
    ["2007", 1030, 540],
]);
As for it’s options, Google Charts offers a large number of options including at least everything I need.
For this case, I was required to create a line chart illustrating our servers’ CPU performance in the selected time range, and the CPU usage data stores each minute.
Draft Google Line Chart
.html
Just need to create a Google Line Chart Div with some time-span selection button in HTML file.
We are using .xls transforming to .html Actually just one line for Google Chart at the bottom
1
2
3
4
5
6
7
8
9
10
11
12
13
14
15
16
17
18
19
20
21
22
23
24
25
26
27
28
29
30
31
32
33
34
35
36
37
38
39
40
41
42
43
44
45
46
47
48
49
50
51
52
53
54
<div id="cpudiv">
    <div style="display: inline-block">
        <h3>
            <a target="blank">CPU Performance</a>
        </h3>
    </div>
    <!--buttons above line chart-->
    <div id="cpubuttons" style="display: none" class="pull-right">
        <style>
            .btn:focus {
                outline: none;
            }
        </style>
        <button class="btn btn-primary btn-xs dim" onclick="drawCpuChart(1)">
            1 H
        </button>
        <button class="btn btn-success btn-xs dim" onclick="drawCpuChart(3)">
            3 H
        </button>
        <button class="btn btn-success btn-xs dim" onclick="drawCpuChart(6)">
            6 H
        </button>
        <button class="btn btn-success btn-xs dim" onclick="drawCpuChart(12)">
            12 H
        </button>
        <button class="btn btn-success btn-xs dim" onclick="drawCpuChart(24)">
            1 D
        </button>
        <button class="btn btn-success btn-xs dim" onclick="drawCpuChart(72)">
            3 D
        </button>
        <button class="btn btn-success btn-xs dim" onclick="drawCpuChart(168)">
            1 W
        </button>
        <button class="btn btn-success btn-xs dim" onclick="drawCpuChart(336)">
            2 W
        </button>
        <!--button click animation-->
        <script>
            document.addEventListener("DOMContentLoaded", function () {
                $("button").click(function () {
                    $(this).addClass("btn-primary").removeClass("btn-success");
                    $(this)
                        .siblings()
                        .addClass("btn-success")
                        .removeClass("btn-primary");
                });
            });
        </script>
    </div>

    <!--Google Chart-->
    <div id="cpu_chart" style="height:200px"></div>
</div>
.js
First thing before coding Javascript is thinking about how to get, parse and compose data.
Fetch Data
There is one point must be aware, which is
Ajaxis an Async Function. We cannot writereturn datain an ajax function, using a function to get the callback data instead.
1
2
3
4
5
6
7
8
9
10
11
12
13
14
15
16
17
18
19
20
//using ajax to fetch data then return here as globle variable
var parentcpuxml = null;

getxml(url, function (cpuxml) {
    var cpuxml = cpuxml.getElementsByTagName("cpu");
    parentcpuxml = cpuxml;
});

//also can use jquery $.ajax function here
function getxml(url, fn) {
    var xhttp = new XMLHttpRequest();
    xhttp.onreadystatechange = function () {
        if (this.readyState == 4 && this.status == 200) {
            fn(this.responseXML);
            //cannot return data directly
        }
    };
    xhttp.open("GET", url, true);
    xhttp.send();
}
Part of cpudata currently looks like:
[[datetime_1, cpuusage_1],[datetime_2, cpuusage_2],[datetime_3, cpuusage_3],……]
1
2
3
4
5
6
7
8
9
cpudata: Array(56)
0: (2) [Tue Mar 19 2019 20:35:08 GMT-0400 (Eastern Daylight Time), 17.69007]
1: (2) [Tue Mar 19 2019 20:34:06 GMT-0400 (Eastern Daylight Time), 7.689963]
2: (2) [Tue Mar 19 2019 20:33:06 GMT-0400 (Eastern Daylight Time), 14.61316]
3: (2) [Tue Mar 19 2019 20:32:06 GMT-0400 (Eastern Daylight Time), 6.920557]
4: (2) [Tue Mar 19 2019 20:31:06 GMT-0400 (Eastern Daylight Time), 46.92161]
5: (2) [Tue Mar 19 2019 20:30:06 GMT-0400 (Eastern Daylight Time), 13.84391]
.......
Draw chart and options
Using the sample code provided by Google to run the line chart.
1
2
3
4
5
6
7
8
9
10
11
12
13
14
15
16
17
18
19
20
21
22
23
24
25
26
27
28
29
30
31
32
33
34
35
36
37
38
function drawChart() {
    google.charts.load("current", { packages: ["corechart"] });
    google.charts.setOnLoadCallback(drawCpuChart);
}

function drawCpuChart() {
    var data = new google.visualization.DataTable();
    //add column name and data type
    data.addColumn("datetime", "Date Time");
    data.addColumn("number", "CPU Usage");

    data.addRows(cpudata);

    var chart = new google.visualization.LineChart(
        document.getElementById("cpu_chart")
    );

    var options = {
        legend: { position: "bottom" },
        backgroundColor: { fill: "transparent" },
        chartArea: { left: "5%", width: "90%", top: "5%" },
        interpolateNulls: true, //default is false, the line chart will be non-sequence.
        pointSize: 3,
        vAxis: {
            //Firm the x axis from 0 to 100, otherwise it will be dynamical as y axis.
            viewWindow: {
                min: 0,
                max: 100,
            },
        },
        animation: {
            startup: true, // Need to add this for animations
            duration: 1000,
            easing: "out",
        },
    };
    chart.draw(data, options);
}
The graphic may look like this:
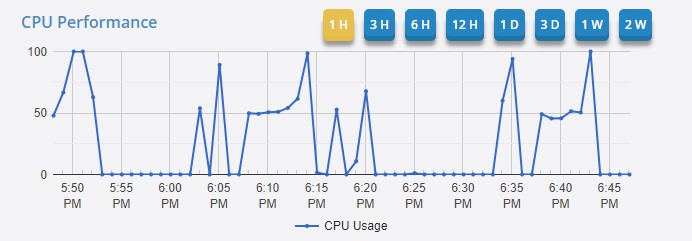
It seems to complete closely, but this is the beginning of this work. Because we’d love to see a clear line chart as above, other than the following one:
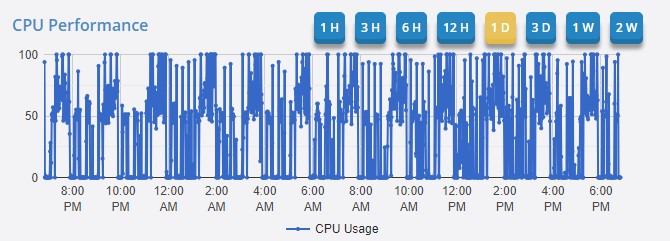
With the wider time span selected (skip the js code how to filter data by time range here), the resolution for my chart is also decreased till the graphic makes no sense.
Data Processing
In order to solve this problem, the first idea I came up with then gave it up immediately is to request the server for each click and filter data on database end, due to its bad user experience that users have to await response every time. As a result, I chose to download the data with the maximum time range user can choose while page loading, then filter the data by Javascript on users’ computers. Unless the computer is very old, users won’t feel too much delay in processing the data.
-Explain it briefly first, maybe give more details in the future-
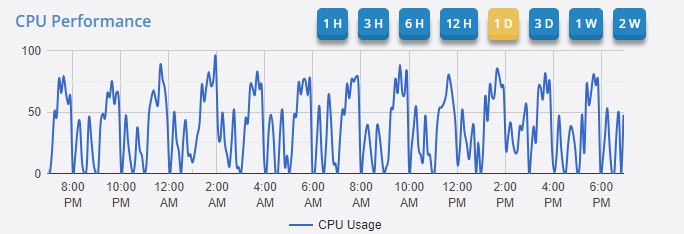
My logic is that if the point number greater than 250, all the data will be re-calculated to 250 points with average. For example, there are 1440 CPU usage data for one day, so firstly the time span should be re-calculated from 1 minute to (1 day _ 24 hr _ 60 min)/250, which means only 250 values on X-Axis with even span. Then calculate the average values in between new time spans to be the new Y-Axis value. Finally, switch the line chart style to curve matching this circumstance.
This is a great opportunity for using
recursionmethod to solve a problem in the real working environment.
1
2
3
4
5
6
7
8
9
10
11
12
13
14
15
16
17
18
19
20
21
22
23
24
25
26
27
28
29
30
31
32
33
34
35
36
37
38
39
40
41
42
43
44
45
46
47
48
49
50
51
52
53
54
55
56
57
58
59
60
61
62
63
64
65
66
67
68
69
70
71
72
73
74
75
76
77
78
79
80
81
82
83
84
85
86
87
88
89
90
91
92
93
94
95
96
97
98
99
100
101
102
103
104
105
106
107
108
109
110
111
112
113
114
115
116
117
118
119
120
121
122
123
124
125
126
127
128
129
130
131
132
133
134
135
136
137
138
139
140
141
142
143
144
145
146
147
148
149
150
151
152
/*The entire javascript code*/
function drawChart() {
    google.charts.load("current", { packages: ["corechart"] });
    google.charts.setOnLoadCallback(drawCpuChart);
    google.charts.setOnLoadCallback(drawDiskChart);
}

function getxml(url, fn) {
    var xhttp = new XMLHttpRequest();
    xhttp.onreadystatechange = function () {
        if (this.readyState == 4 && this.status == 200) {
            fn(this.responseXML);
            $("#cpuloading").hide();
            $("#diskloading").hide();
            $("#cpubuttons").show();
            $("#diskbuttons").show();
        }
    };
    xhttp.open("GET", url, true);
    xhttp.send();
}

//draw chart method
var parentcpuxml = null; //using ajax to fetch data then return here as globle variable

function drawCpuChart(hour = 1) {
    //by default time span is 1 hour
    if (parentcpuxml !== null) {
        //avoid requesting data from server on switchting time span
        drawCpuChart_data(parentcpuxml, hour);
        return;
    }
    var url = window.location.href.toString() + "&getcpu=1&session=readonly";
    //this will return the maximum data we need-- 2 weeks
    getxml(url, function (cpuxml) {
        var cpuxml = cpuxml.getElementsByTagName("cpu");
        parentcpuxml = cpuxml;
        drawCpuChart_data(cpuxml, hour);
    });
}

function drawCpuChart_data(cpuxml, hour) {
    var options = {
        legend: { position: "bottom" },
        backgroundColor: { fill: "transparent" },
        chartArea: { left: "5%", width: "90%", top: "5%" },
        pointSize: 2,
        vAxis: {
            viewWindow: {
                min: 0,
                max: 100,
            },
        },
        animation: {
            startup: true /* Need to add this for animations */,
            duration: 1000,
            easing: "out",
        },
        interpolateNulls: true,
    };

    var cpudata = [];
    var cpudata_filtertime = [];

    //set the start date we need from file
    var startDate = new Date();
    startDate.setHours(startDate.getHours() - hour);

    //filter xml data in needed time span into an array like [[datetime_1, cpuUsage_1],[datetime_2, cpuUsage_2],...]
    for (let i = 0; i < cpuxml.length; i++) {
        //filter datetime
        if (new Date(cpuxml[i].getAttribute("created")) >= startDate) {
            var arr = [];
            arr.push(new Date(cpuxml[i].getAttribute("created")));
            arr.push(Number(cpuxml[i].getAttribute("value")));
            cpudata_filtertime.push(arr);
        }
    }

    if (cpudata_filtertime.length <= 250) {
        cpudata = cpudata_filtertime;
    }

    //if number of data greater than 250, re-calculate and average data
    if (cpudata_filtertime.length > 250) {
        //curve line chart
        options["curveType"] = "function";
        options["pointSize"] = 0;

        //new time span
        var increment =
            (cpudata_filtertime[0][0].valueOf() -
                cpudata_filtertime[
                    cpudata_filtertime.length - 1
                ][0].valueOf()) /
            250;
        var startDate = cpudata_filtertime[cpudata_filtertime.length - 1][0];

        var repopulateData = function (
            cpudata_filtertime,
            startDate,
            increment,
            arr = []
        ) {
            if (cpudata_filtertime.length > 0) {
                var newDate = new Date(startDate.valueOf() + increment);
                var newValueList = [];

                //calculate new average cpu usage in a new individual time span
                var getAvg = function (newValueList) {
                    var sum = 0;
                    for (let j = 0; j < newValueList.length; j++) {
                        sum += newValueList[j];
                    }
                    return sum / newValueList.length;
                };

                var lastValue =
                    cpudata_filtertime[cpudata_filtertime.length - 1]; //also the latest date with value cause data has been sort by data desc
                while (lastValue != null && lastValue[0] <= newDate) {
                    newValueList.push(lastValue[1]); //return value then delete
                    cpudata_filtertime.pop();
                    lastValue =
                        cpudata_filtertime[cpudata_filtertime.length - 1];
                }

                var avgValue = getAvg(newValueList);
                arr.push([newDate, avgValue]);
                return repopulateData(
                    cpudata_filtertime,
                    newDate,
                    increment,
                    arr
                ); //Recursion here
            }
            if (cpudata_filtertime.length == 0) {
                return arr; //Recursion stop
            }
        };
        cpudata = repopulateData(cpudata_filtertime, startDate, increment);
    }

    var data = new google.visualization.DataTable();
    data.addColumn("datetime", "Date Time");
    data.addColumn("number", "CPU Usage");
    data.addRows(cpudata);

    var chart = new google.visualization.LineChart(
        document.getElementById("cpu_chart")
    );
    chart.draw(data, options);
}
Final View
What I learned from this case
- Got familiar with
Ajaxespecially theasyncreturn data part. - Learned the knowledge of
sessionread/write permission in HTTP request( I didn’t mention in this article); - Become an expert on
Google Chartslibrary :). - Brought what I learned in school to the real world:
Recursion,Algorithm.